Performance
Unused and redundant indexes, the most expensive statements on a server, and query plans.
Index health
A database's page shows Index health, and each table's structure tab marks the indexes concerned:
- Redundant — another index already covers it: one with the same columns, or a longer one whose columns start with this index's (of the same kind, not partial). A unique index is reported only when an identical unique index exists; primary keys, partial and expression indexes never are.
- Unused — never used since the server's statistics started. When that was less than a week ago, Fleetdock says so: "unused" may then just mean "not yet".
Every finding comes with the DROP INDEX statement to review and run in the SQL console.
Fleetdock never drops an index itself.
Usage statistics come from:
| Engine | Source | Needs |
|---|---|---|
| PostgreSQL | pg_stat_user_indexes | nothing (always collected) |
| MySQL 8 | performance_schema | on by default |
| MariaDB | performance_schema, else information_schema.INDEX_STATISTICS | performance_schema=ON, or userstat=1 |
Without them, only redundant indexes are reported.
Top queries
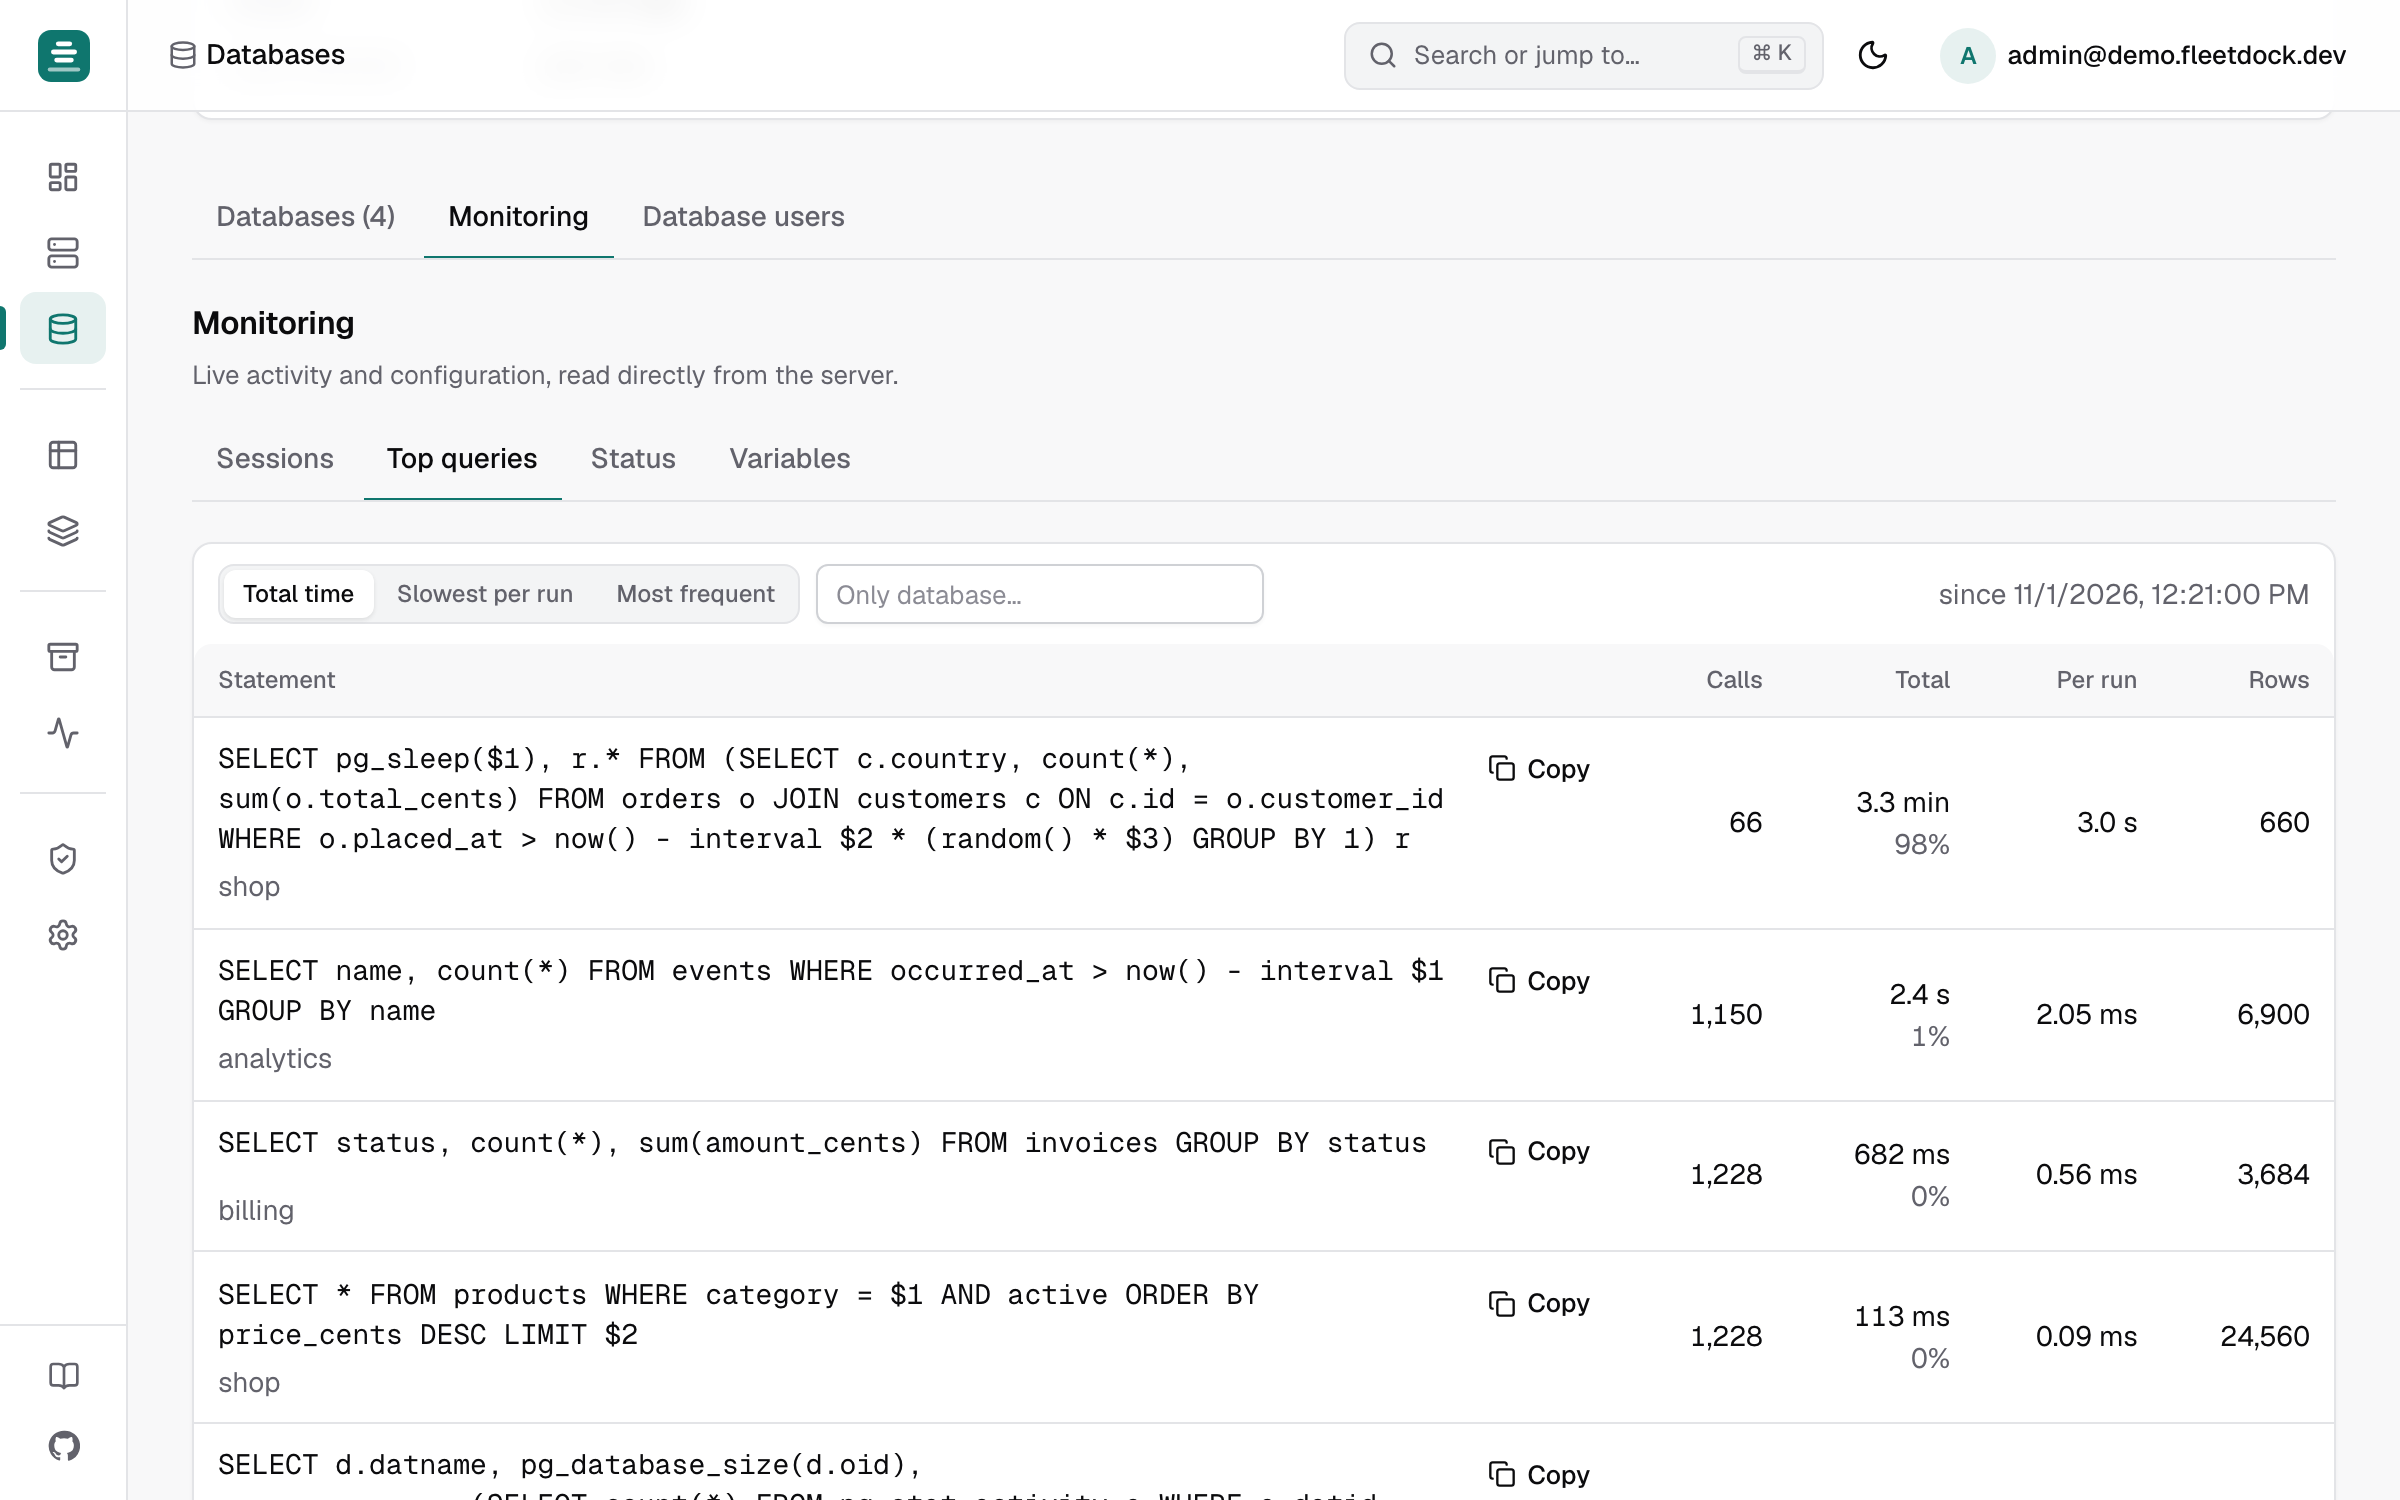
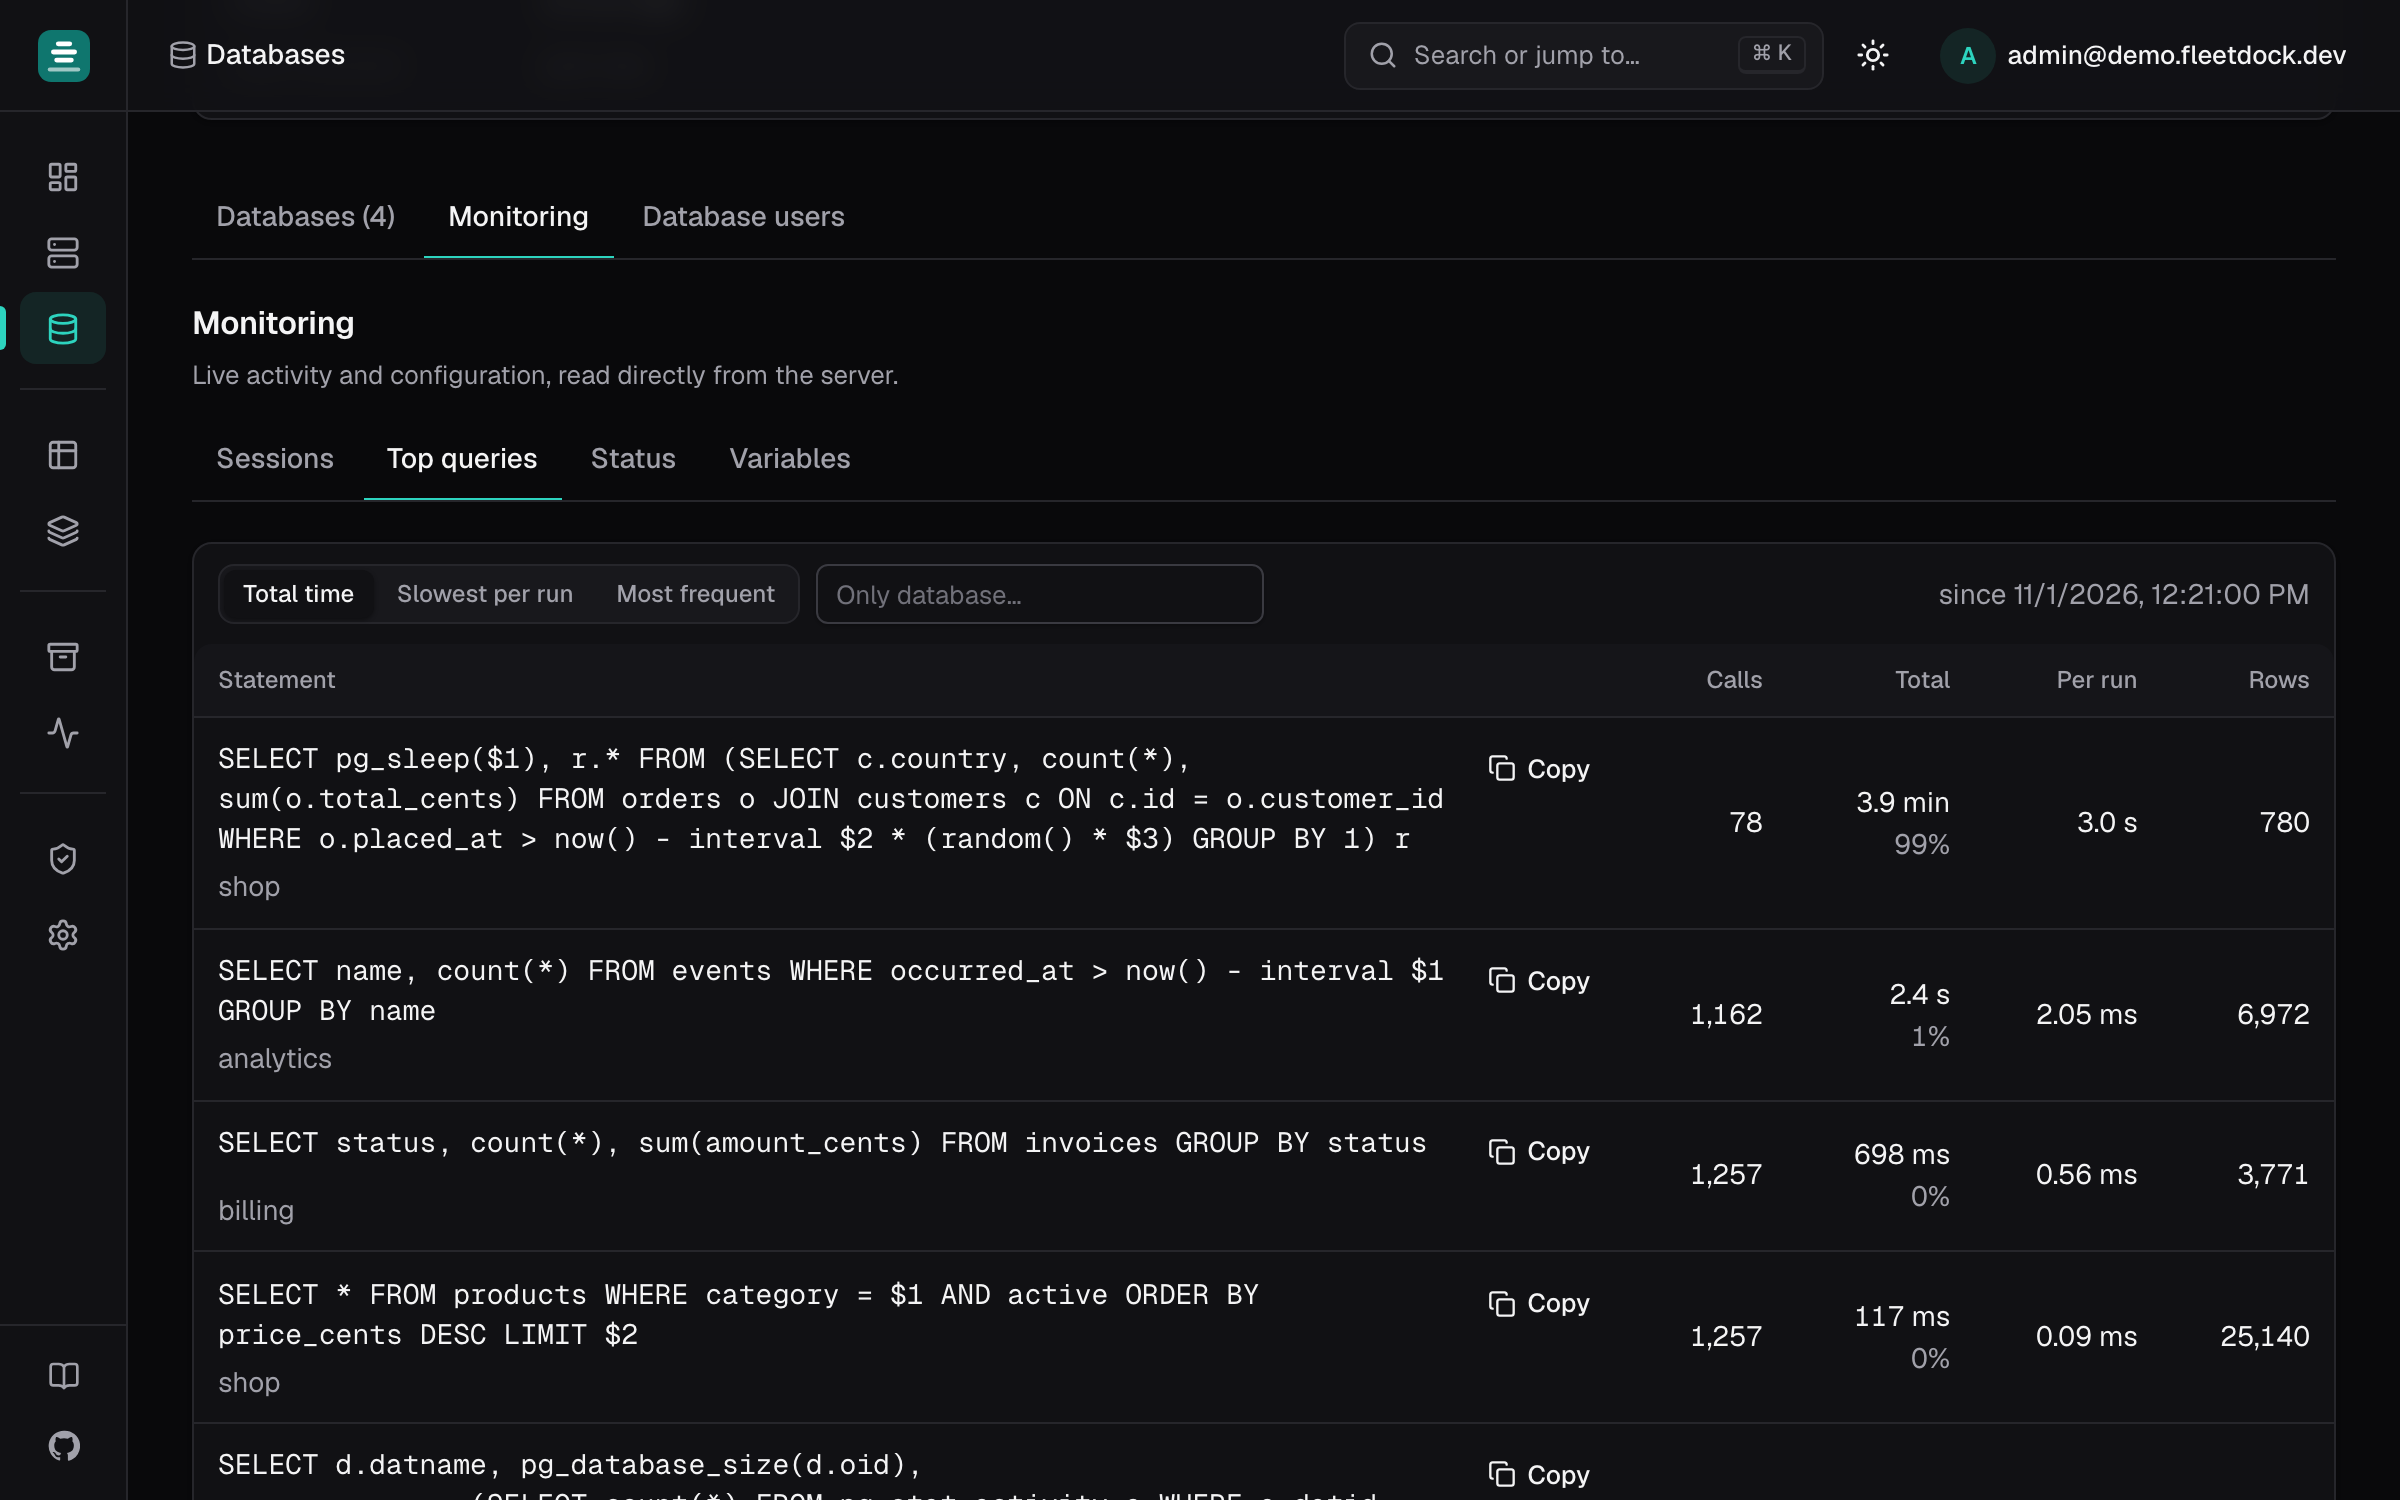
A database server's Monitoring → Top queries lists the statements that cost the most,
sortable by total time, mean time or calls, and filterable by database. The query text is
normalised by the server: literals are replaced by ? or $1.
- PostgreSQL reads
pg_stat_statements. Add it toshared_preload_librariesinpostgresql.conf, restart, then runCREATE EXTENSION pg_stat_statements;in thepostgresdatabase. Until then, the tab explains what is missing. - MySQL and MariaDB read
performance_schema.events_statements_summary_by_digest.performance_schemais on by default in MySQL 8; on MariaDB setperformance_schema=ONand restart.
Viewing needs instance:read.
Query plans
The SQL console's Explain and Analyze draw a statement's plan as a tree. See SQL console.